
Sociality Function
The algorithm is that each point joins with the point lying closest to it, provided no other point shares the exact same distance to ensure an unique connection. In case multiple points have the nearest distance, the algorithm proceeds with the next nearst distance, as long as there is an unique distance found or no more points are left. In this way pairs of points are formed. The different pairs are united into one group, if at least one point in the pairs matches. Thus multiple groups of different sizes emerge. Although the algorithm is simple and can be programmed to get the resulting number of emerging point groups and their sizes, the function lying behind it does not seem to be trivial. Depending on the number of points, a different number of groups and sizes heavily vary.
Analysis of Prime Group Counts
Based on the data provided for n=1 to n=100, the values of the group counts lie between 2 and 1821 and exactly 28% of the Group counts are prime numbers. Comparing the 28% prime density to the standard prime density of numbers up to 1821 (which is approximately 15.4%): The fact that the "Group counts" are nearly twice as likely to be prime as a random set of integers suggests that the algorithm isn't just picking numbers - it is actively "filtering" for them. The "unique distance" rule shatters symmetrical composite groups. It acts as a "Symmetry Breaker" that prevents large, even, or highly divisible clusters from staying together. In geometry, highly composite numbers (like 12, 24, 48) are associated with high symmetry. A group of 24 points on a grid is very likely to form a rectangle, a square, or a symmetrical "blob." Symmetrical shapes produce identical distances. If a point is in the center of a symmetrical cluster, it will have at least two "closest neighbors" at the exact same distance. The "unique distance" rule shatters these symmetrical composite groups. It acts as a "Symmetry Breaker" that prevents large, even, or highly divisible clusters from staying together.
Why Odd n Produces Primes
Out of the 28 prime group counts identified, 27 of them occur when n is odd. The only exception in the entire set is n=2. The reason for this "Odd-N Prime Rule" boils down to the existence of a center point in the grid and how that center point interacts with the "unique distance" rule. The Unique Distance Impact: In an even grid, because every point has a mirrored counterpart, it is much easier for "distance ties" to propagate through the whole system. This usually forces the grid to resolve into a large number of identical small even-numbered pairs or blocks, resulting in an even (composite) total group count. In an odd grid, the center point acts as a "symmetry breaker." It doesn't have a mirror, so its unique distance connections often ripple outward in a way that prevents the entire grid from settling into a perfectly balanced, even-numbered state. By filtering for odd n (from n=1 to n=99), the algorithm produces a prime number more than half the time (54%). In contrast, if you were to pick a random odd number from the same range, you would only have about a 30.6% chance of hitting a prime. This means the algorithm is 1.76 times more efficient at producing primes.Square Grid Structures
Emerging Matrix (Loading...)
Square grid stucture of 10000 points grouped by sociality algorithm
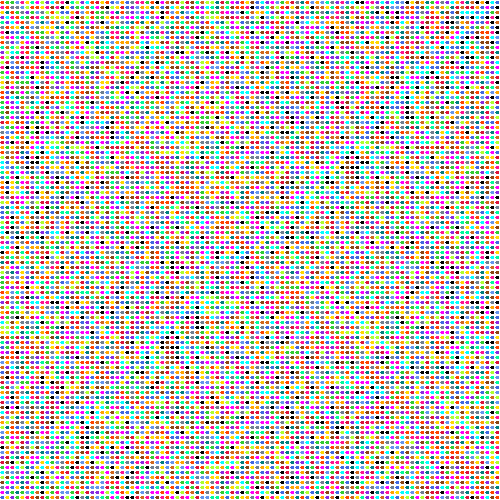
This graphic shows the groups the 10000 points are grouped into by the sociality algorithm. Each group is colored differently. You can see that the groups are in some cases forming symmetric patterns.
Line Structures
Counts of Group Sizes per Index
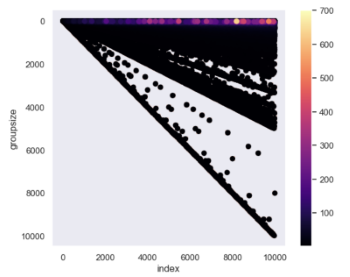
This heatmap shows the number of group sizes that are created per index. You can see that for smaller group sizes there are up to hundreds of groups with identical size. Another interesting observation in this vizualisation is that lines are created, which shows a correlation between the indices. The line dividing the picture in the middle consists of the samples where the groupsize is equal to the index, meaning only one group is created.
Number of Groups
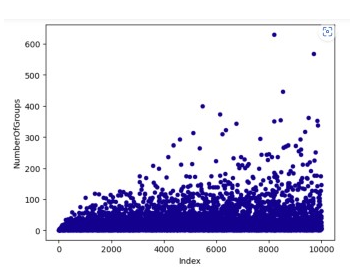
This scatter plot maps the index to the number of groups that are created. The number of emerging groups stays rather constantly in the range from 1 to 100, even though with higher indices the number of higher valued "outliers" increases.
Close Up Number of Groups
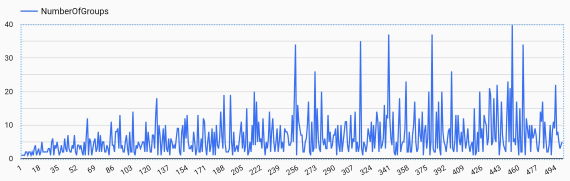
This line chart is a close up to the number of emerging groups from indices 0 - 500.